Open Source Web3 Backtester
The Problem
Backtesting DeFi strategies is an absolute pain. We ran backtesting for multiple strategies for Robo Vault for design, configuration, and even marketing decisions. It was a massive time sink, and the most challenging part: pulling the on-chain data required for the tests.
Let’s walk through the steps. Say you want to backtest a delta-neutral strategy that contains LP positions on a Univ2 fork, along with lending and borrowing on AAVE. Here’s the list of data you’re going to need at a minimum:
- LP Data
– Token reserves
– Total Supply
– Token price
– Trading Fees - Farm data (Masterchef)
– Reward Token Price
– RewardsPerSecond / Block - AAVE
– Lending rates
– Borrowing rate
You’ll need this data to be historic for the period you wish to test and some method to synchronise the data. You can use blocks as the x-axis, but that’s problematic for various reasons (variability & timestamping), so you’ll likely roll up the data into time-based snapshots, say 1 minute, 5 minutes, or 1 hour, for example.
Following this, you’d need to write modules to simulate Univ2 positions, farming positions and lending/borrowing positions to track the value, revenue, and costs of the strategy.
Only after these steps are you ready to start writing the strategy backtest. And you don’t even have a method to chart or analyse the results.
The Solution — Web3 Backtester
The devs are suffering. Let’s work on that. We suffered so you don’t have to.
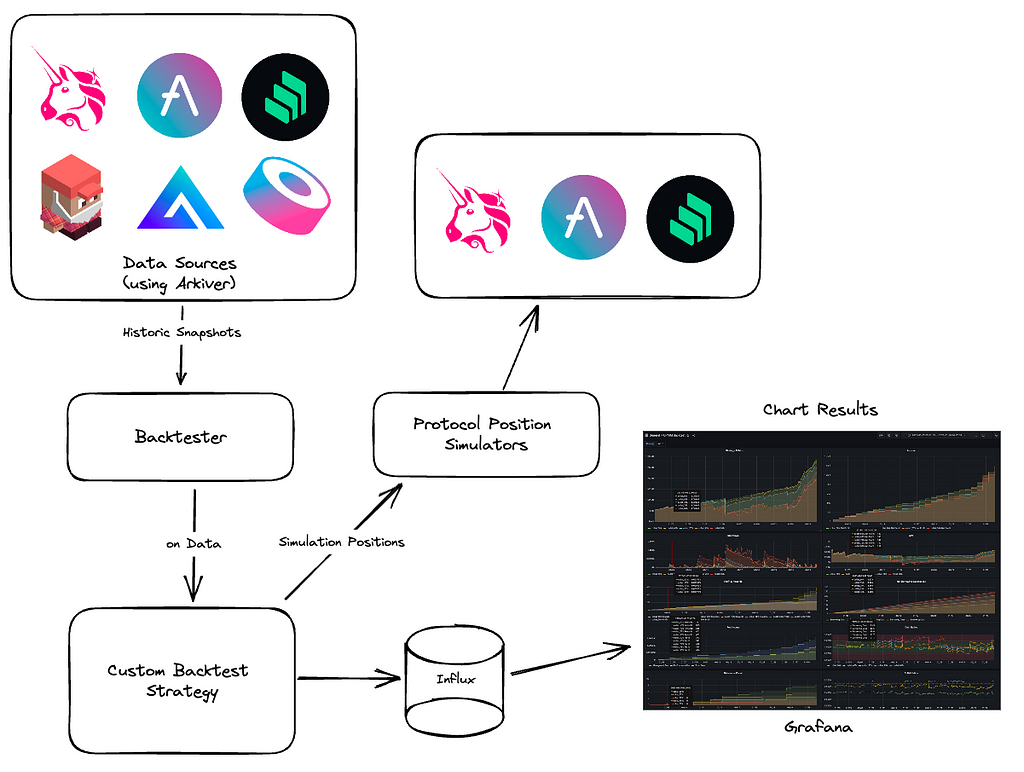
Introducing the Web3 Backtest project, it’s a library that’s goal is to simplify web3 backtesting and allows devs to write strategies as the first step, not the last. The library aims to provide the boilerplate infrastructure for:
- Fetching historic onchain market data & synchronising it for a variety of protocols and chains.
- Simulating market positions, such as univ3 positions, perps and lending positions.
- KPI calculations to use in strategy or analyse them
- Logging backtest data, so you can dive deep into the intricate details of the strategy performance
- Grafana integration for flexible data visualisation
Fetching Historical Data with Arkiver
Arkiver is a web3 indexing tool built by Robo Labs and it makes fetching historic historical on chain data seamless. It’s well suitable for backtesting data because of its flexibility and smooth dev experience.
We were able to index and roll up the data into 1m and 1h snapshots with ease. Arkiver lets you write small indexing scripts and once deployed, generates a GraphQL endpoint. Most important, you can run the index jobs & GraphQL server locally, which makes development and iterating a breeze.
Configuring a Backtest
Let’s look at a simple example, a simple strategy that adds liquidity to a univ2 (eg Camelot) only when the market volatility is low.
The first step is setting up the Backtest and the data source. We’re going to need the LP and farm data for Camelot:
const main = async () => {
 const USDCWETH = '0x794a61358D6845594F94dc1DB02A252b5b4814aD'

 const sources: DataSourceInfo[] = [
 { chain: 'arbitrum', protocol: 'camelot-dex', resoution: '1m', config: { pairs: [USDCWETH] }},
 { chain: 'arbitrum', protocol: 'camelot-farm', resoution: '1h', config: { pools: [USDCWETH] }}
 ]

 const bt = await Backtest.create(
 new Date('2023-01-01'),
 new Date('2023-02-01'),
 sources
 )

 const strategy = new LPStrategy() // This is the strategy class. More to come...
 bt.onData(strategy.onData.bind(this))
 bt.run() // Run the backtest
}
Here we see the following:
- Configure data sources. The test period is all of January 2023, and we’re requesting camelot dex and darm data for the WETH/USDC pair with 1m and 1h resolution respectively
- Subscribe to the strategy to listen to the onData event. This event is called for each synchronised data snapshot, in time order.
- run the backtest
Writing a Strategy
Let’s write the strategy class to open positions when vol is low, and exit when vol is high
class LPStrategy {
 vol: MetricsVolatility
 univ2: UniV2PositionManager
 masterChef: MasterChefPositionManager
 pos?: UniV2Position
 holdings: number = 1000000 // 100k USDC

 constructor() {
 this.vol = new MetricsVolatility() // From the metrics library to track volatility
 this.univ2 = new UniV2PositionManager() // Can simulate univ2 positons
 this.masterChef = new MasterChefPositionManager() // Can simulate farming positions
 }

 public async onData(snapshot: DataSnapshot<Snapshots>) {
 // Update
 this.vol.update(snapshot.data['camelot-dex'])
 this.univ2.update(snapshot.data['camelot-dex'])
 this.masterChef.update(snapshot.data['camelot-farm'])

 // If the position is closed and vol is below VOL_THRESHOLD, open a new position
 if (!this.pos && this.vol.value() < VOL_THRESHOLD) {
 this.pos = this.univ2.addLiquidity('USDC', 'WETH', this.holdings)
 this.farm.deposit(this.pos)
 }

 // else if the positions is open, and vol is above VOL_THRESHOLD, close the position
 if (this.pos && this.vol.value() > VOL_THRESHOLD) {
 const rewards = this.farm.claimAndWithdraw('USDC')
 this.holdings = this.pos.close() + rewards
 this.pos = undefined
 }
 }
}
Here we’re using the Metrics library to calculate the volatility, the Univ2 Position Manager and Master Chef position managers to simulate the strategies position. Then it’s as simple as opening and closing the position as required.
Note: The Metrics library is in-progress.
Analysing Results
The library contains some boilerplate to log your backtest data to an InfluxDB, along with a docker-compose file to run the InfluxDB and Grafana locally. Here’s what logging might look like for each data update:
public async log() {
 Log.writePoint({
 tags: {
 name: "strategy name if you\'re running multiple strategies"
 // Other tags
 },
 fields: {
 aum: this.pos.valueUsd(),
 token0: this.pos.tokens(0),
 token0: this.pos.tokens(1),
 token0Price: this.dex.token0Price,
 token1Price: this.dex.token1Price,
 totalSupply: this.dex.totalSupply,
 },
 timestamp: new Date(this.timestamp),
 })type
}
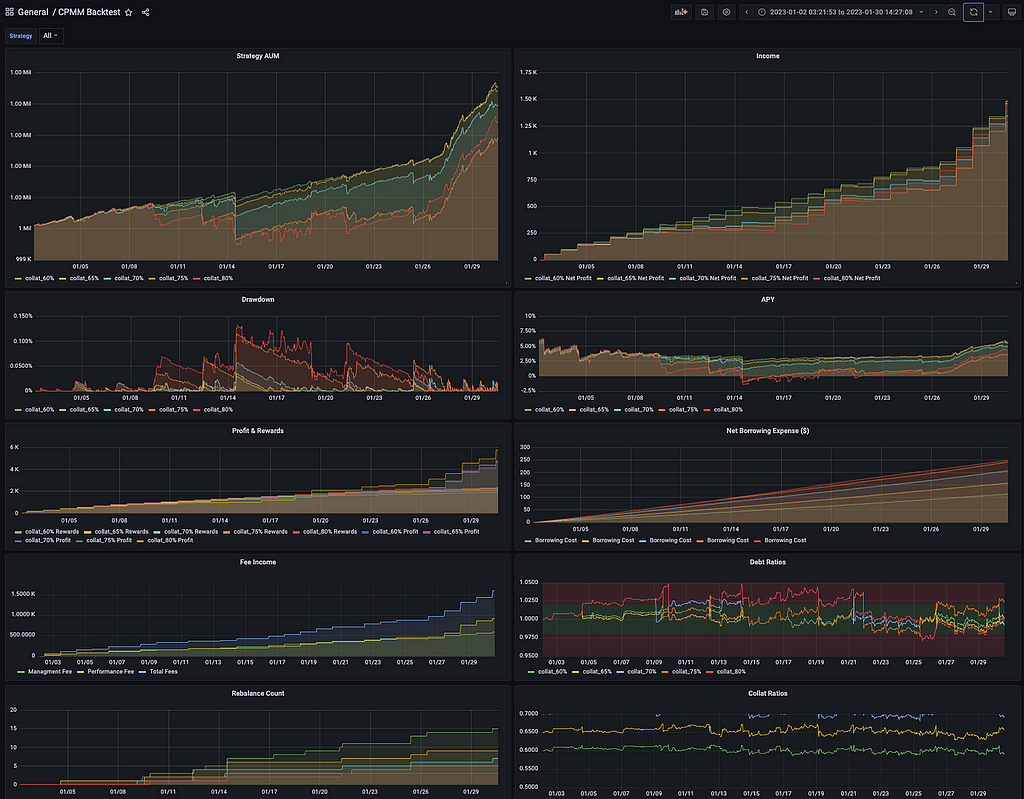
And here’s an example of a Grafana Dashboard for a more complex strategy backtest, containing aum, drawdown, revenue, costs, APY, rewards, lending position health, IL, rebalance costs and more. This example is available in the /lib/examples/ folder in the repository.
Future Plans
- Data sources are currently limited, we’ll continue expanding our backtesting tool to support additional protocols over time with demand.
- The Metric library isn’t available in the library yet. It will provide metrics to aid in the strategy, but also to analyse the strategy results.
- A generic Wallet API to simulate wallets and save users from calculating holdings.
- Grafana is super flexible but a little bloated for those who just want a single simple chart. We plan on adding node native charting.
- Web-based backtesting: Create a small app where people can write backtests in-browser and see the strategy performance charted. Similar to what Zipline did way back.
Get in Touch
- We welcome contributors! Please help ????
- If this is all too much and you just want someone to write up the backtests for you, we at Robo Labs do consulting and can help you out. Feel free to hit up either : @SmoothBotz or @degenRobot